TASK 4: QUALITY OF LIFE GRAPHING INVESTIGATION
Step 1: Graphing Review
Do you remember the different types of graphs, how to create them, and how to analyze them?
Check out the link below for Ms. Singh's graphing review.
Do you remember the different types of graphs, how to create them, and how to analyze them?
Check out the link below for Ms. Singh's graphing review.
| graphing.pdf |
Step 2: Learn How to Use "Numbers" To Create Graphs
"Numbers" is an app on the iPad that uses spreadsheets to organize numbers. One of its features is that it can help you create various types of graphs.
Below are some data tables taken from Statistics Canada that you can use to practice creating different types of graphs in "Numbers".
"Numbers" is an app on the iPad that uses spreadsheets to organize numbers. One of its features is that it can help you create various types of graphs.
Below are some data tables taken from Statistics Canada that you can use to practice creating different types of graphs in "Numbers".
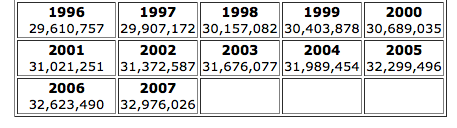
1. Line Graph: Canada's Population from 1996 - 2007
| canadapopulation.png |
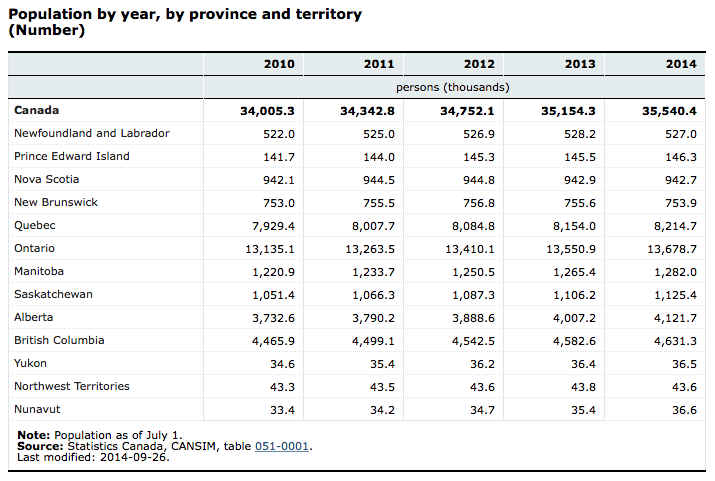
2. Bar Graph: Population in Different Provinces and Territories (note: just pick one year, and numbers are in thousands)
| provterrpopulation.png |
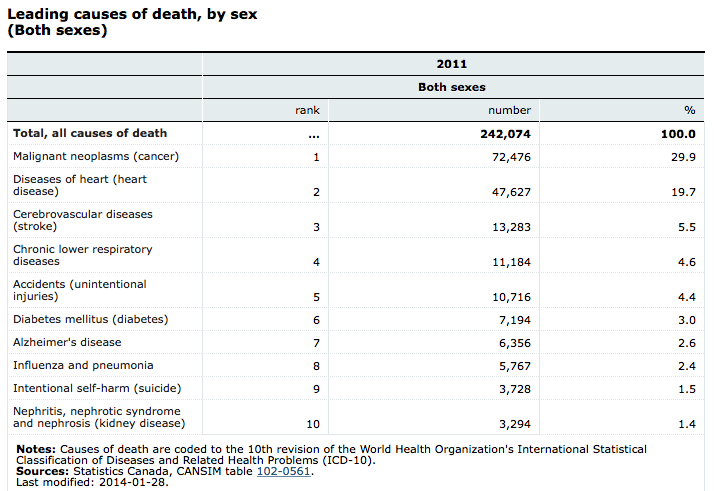
3. Pie Chart: Leading Causes of Death
| causesofdeath.png |
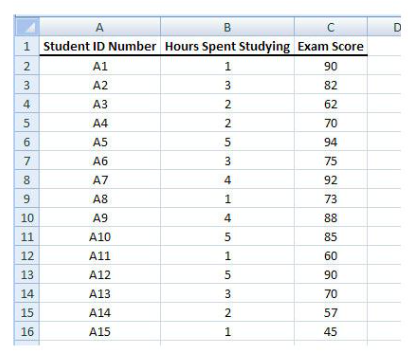
4. Scatter Plot: Hours studying and test scores
| hoursstudyingtestscores.png |
Step 3: Background Information on the World's Population
In 2011, the world welcomed its 7 billionth person. Watch this video from National Geographic to learn about some world statistics.
What is life like for the world's people? Well, it depends on many things, including where you live. Watch this video to learn about people from different parts of the world.
Step 4: Data Collection
1. You will be examining quality of life indicators of 5 countries. You will be looking at data from: Canada, China OR India, and 3 other countries of YOUR CHOICE.
2. Go to the Population Reference Bureau website. Go to "Data Finder". Go to Profiles: International: Countries.
3. FOLLOW THE INSTRUCTIONS CAREFULLY TO CREATE A CUSTOM TABLE FOR YOUR 5 COUNTRIES, AND THE QUALITY OF LIFE INDICATORS YOU WOULD LIKE TO EXAMINE.
Step 5: Creating Graphs and Analysis
1. Using the data, you will create 1 bar graph, 1 set of pie charts (you will actually have 5 pie charts, one for each country), and one scatter plot.
2. Make sure you have the right kind of data for each graph type. You may need to change your quality of life indicators.
3. BEFORE YOU START GRAPHING, MAKE SURE YOU HAVE ALL THE DATA YOU NEED. SOMETIMES, THERE IS NO DATA FOR SOME CATEGORIES.
4. Using "Numbers", create your graphs. Make sure you include a title, and label axes and sectors.
5. Import your graphs into Pages.
6. For each graph type, answer the following questions:
- What is the quality of life indicator being measured?
- What pattern do you notice?
- Who might use this information? For what purpose?
Step 6: Check the Success Criteria
Each graph type will be marked separately. Check the success criteria below.
| quality_of_life_graphs_sc.pdf |
TASK 3: CAREER EXPLORATIONS
Step 1: Interest Survey
Complete one (or both) of the surveys listed below to find out about various occupations and post-secondary options based on your interests and strengths.
Step 2: Read About Careers
After you have completed your survey, a number of occupations will be suggested based on your interests. Spend some time exploring these occupations to find out more about them.
Step 3: Choose One Career and Research
Choose one career that you would like to find out more about. Research the following:
Step 4: Present Your Findings
You may work by yourself or with a partner. You will be presenting your findings to your classmates using Keynote. Open the file below for tips on how to create an effective presentation.
Complete one (or both) of the surveys listed below to find out about various occupations and post-secondary options based on your interests and strengths.
- Click HERE for MyBlueprint. Login. Under Menu, go to Assessments, and select Explorations. Complete the survey.
- Click HERE for Career Cruising. Login using the name and password given in class. Set up an IPP. You are responsible for remembering your username and password. Use a valid email address to allow you to retrieve your username and password if necessary. Choose Explore My Interests. Select Matchmaker. Complete the survey.
Step 2: Read About Careers
After you have completed your survey, a number of occupations will be suggested based on your interests. Spend some time exploring these occupations to find out more about them.
Step 3: Choose One Career and Research
Choose one career that you would like to find out more about. Research the following:
- What you would do
- Where you might work
- How much money you can make
- What education or training is required
- What will be the demand for this job in the future
Step 4: Present Your Findings
You may work by yourself or with a partner. You will be presenting your findings to your classmates using Keynote. Open the file below for tips on how to create an effective presentation.
| how_to_keynote.pdf |
Step 5: Check the Success Criteria
| success_criteria_career.pdf |
TASK 2: SIMPLE MACHINES AND FOOD
Step 1: Read about simple machines
Find out about simple machines by reading through the information in the "Simple Machines" app.
Step 2: Apply what you have learned to FOOD PRODUCTION, HARVESTING, OR PREPARATION
For each type of simple machine, think of an example of a device that contains this simple machine. The device MUST BE RELATED TO food production, food harvesting, or food preparation. The simple machines you must include are:
- First class levers
- Second class levers
- Third class levers
- Wheel and axle
- Pulleys (choose one type)
- Inclined planes
- Wedges
- Screw
Step 3: Communicate your information
- Use Keynote
- Each slide should contain:
- Name of the simple machine
- Name and picture of the device (include website to credit the source of the image)
- Appropriate labels
- Brief explanation of the purpose of the device, how it works, and why it is important. Example sentence starters: The purpose of the device is to _________ . It works by ___________ . This device is important because ____________ .
- Add introduction and conclusion slides.
TASK 1: LEARNING STYLES POSTER
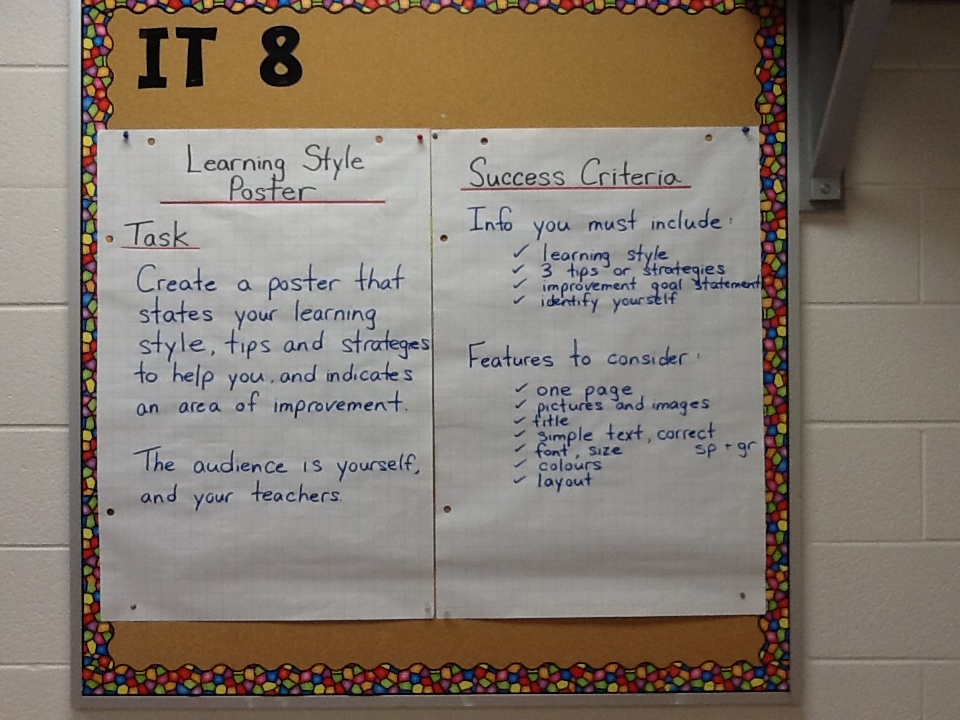
Step 1: Watch a video
Click here for a fun video introducing different learning styles. ("Understanding Your Learning Styles", produced by George Brown College Counselling and Student Services)
Step 2: Complete the survey
Click here for a survey to find out about your learning style preferences.
Step 3: Record your results and research
Using an APP OF YOUR CHOICE, answer the following questions:
- What type of learner are you?
- What are three tips and strategies that can help you?
- Complete the sentence: This term I plan to improve ____ . I will do this by ___ .
Step 4: Share your research
